This report goes through our valuation of Tesco PLC using discounted cash flow (DCF) analysis. Tesco is a multinational grocery and general merchandise retailer. It was founded in 19191 and is headquartered in Welwyn Garden City, United Kingdom.2
Discounted cash flow (DCF) is a method of valuating a company through the forecast of its future cash flows, which are discounted to the present values.3
Note: unless otherwise stated, the values in this report are presented to the nearest million (in the case of monetary values) or to 2 decimal places (in the case of percentages).
Overall Result
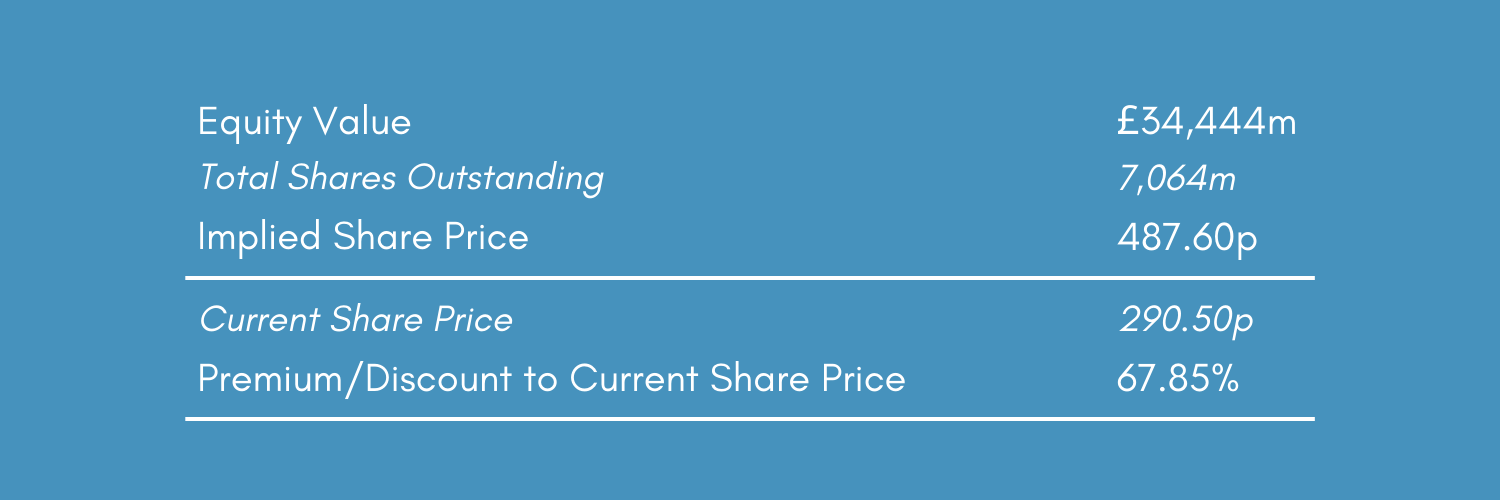
Our estimated equity value of Tesco is £34,444m (millions). This is based on the assumptions of the weighted average cost of capital (WACC) being 4.659503% (to 6 d.p.) and the perpetual growth rate of free cash flow (PGR) being 2.00%.
The implied share price is the estimated equity value per share. Therefore, it can be calculated by dividing our estimated equity value by Tesco’s shares outstanding. As of December 29, 2023, Tesco’s shares outstanding were 7,064m4 (to the nearest million). Dividing the estimated equity value by this, the implied share price is 487.60p (to 2 d.p.).
As of December 29, 2023, Tesco’s closing share price was 290.50p.5 This means that the implied share price forms a 67.85% premium.
Sensitivity Analysis
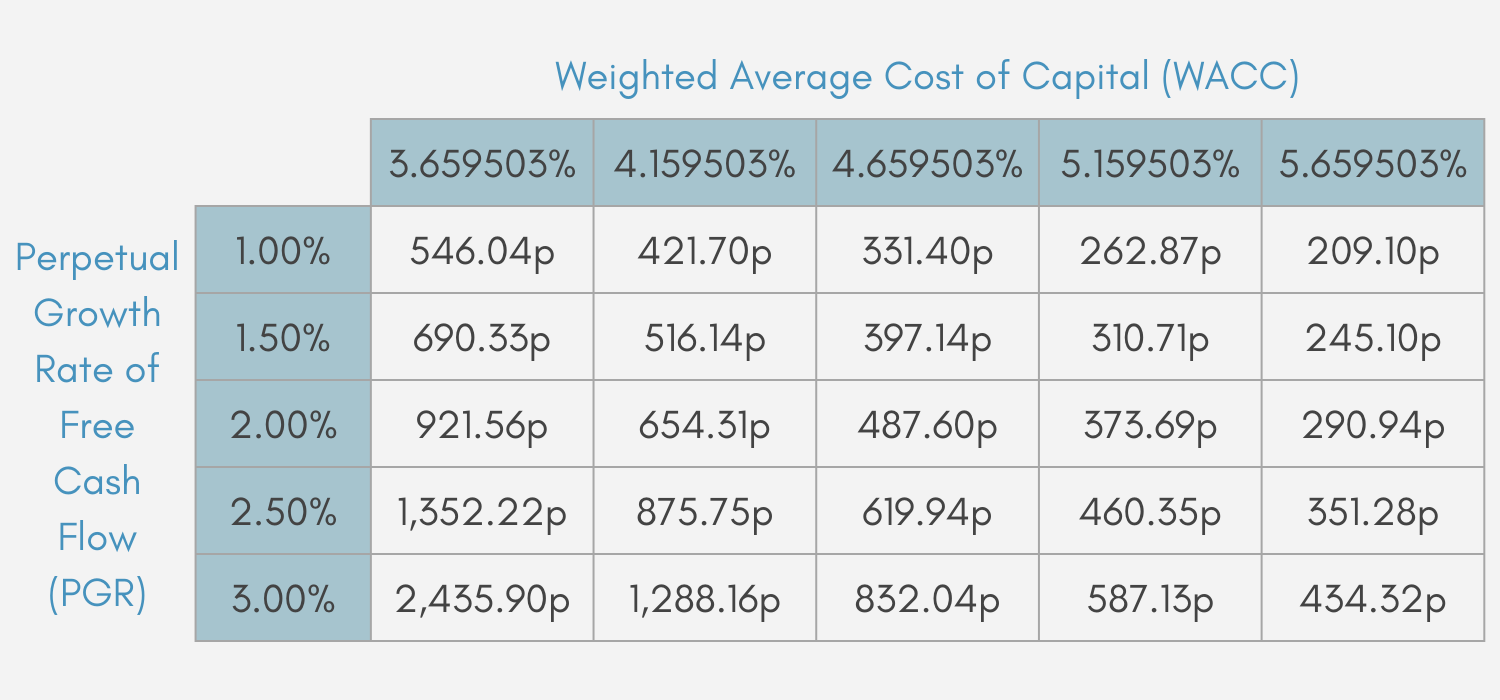
Varying our assumptions of WACC and PGR, Table 2 shows the implied share prices at different assumed WACC and PGR values.
Overview of Equity Value Calculation
Equity value involves the sum of enterprise value and non-operating assets, subtracted by financial (non-operating) liabilities, preferred stocks and non-controlling (minority) interests.
Enterprise value
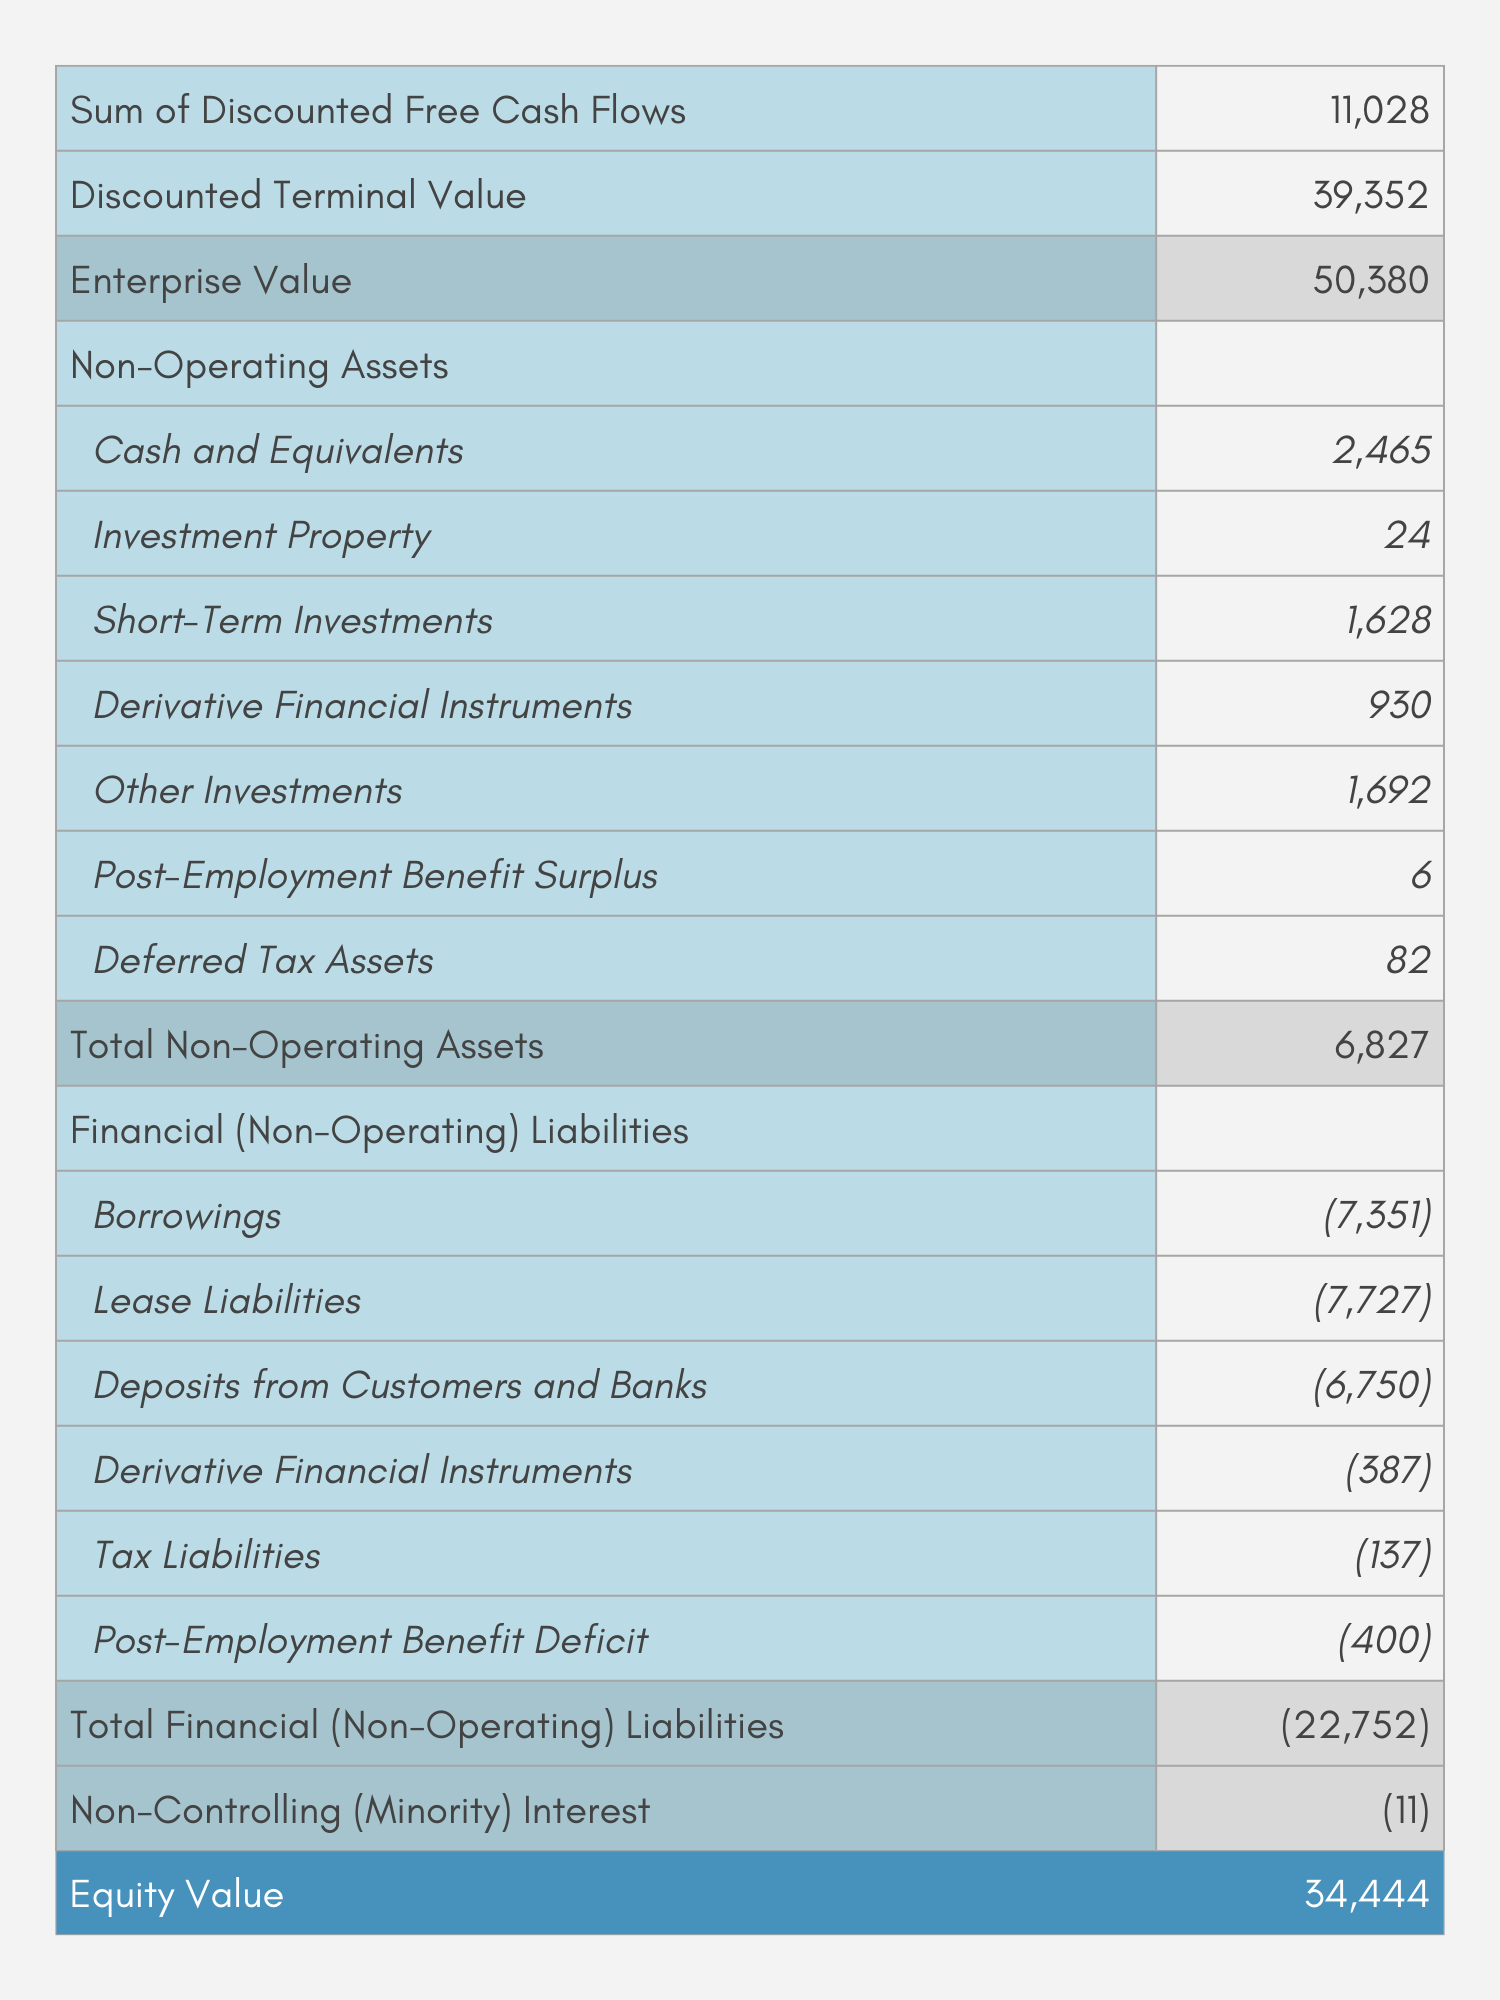
Enterprise value is calculated by adding the sum of discounted free cash flows and the discounted terminal value together. According to our calculation, Tesco’s sum of discounted free cash flows from 2024 to 2033 is £11,028m and their discounted terminal value for the year 2034 onward is £39,352m. This results in the enterprise value of £50,380m.
Non-Operating Assets
Non-operating assets are defined as assets that are not part of Tesco’s core operations. Using the information on Tesco’s assets in 2023,6 we identify the following assets as being non-operating:
- cash and equivalents
- investment property
- short-term investment
- derivative financial instruments
- other investments
- post-employment benefit surplus
- deferred tax assets.
The value of each of these non-operating assets is shown in Table 3. Summing these values together, Tesco’s total non-operating assets amount to £6,827m in value.
Financial (non-operating) liabilities
Financial liabilities (also known as non-operating liabilities) involve liabilities that are not related to Tesco’s ongoing operations. With the information on Tesco’s liabilities in 2023,7 we identify the following items as being financial liabilities:
- borrowings
- lease liabilities
- deposits from customers and banks
- derivative financial instruments
- tax liabilities
- post-employment benefit deficit.
The value of each of these items is also shown in Table 3. Summing the values together results in the value of Tesco’s total financial liabilities being £22,752m.
Preferred stocks
Tesco does not have preferred stocks.8 Therefore, preferred stocks are not included in our calculation of Tesco’s equity value.
Non-controlling (minority) interest
Non-controlling interest (also known as minority interest) refers to the total value of the proportion of Tesco’s subsidiaries not owned by Tesco. This amounts to £11m for Tesco.9
Using these mentioned values, Tesco’s equity value can be calculated to be £34,444m.
Calculating WACC
Weighted cost of capital (WACC) refers to Tesco’s average cost of financing its assets. It is a key variable in DCF valuation and is used (as part of the process of discounting future values) both in the calculation of the sum of discounted free cash flows and of the discounted terminal value, the two components of the enterprise value (which is, as described above, in turn used to calculate the equity value).
Overall Result
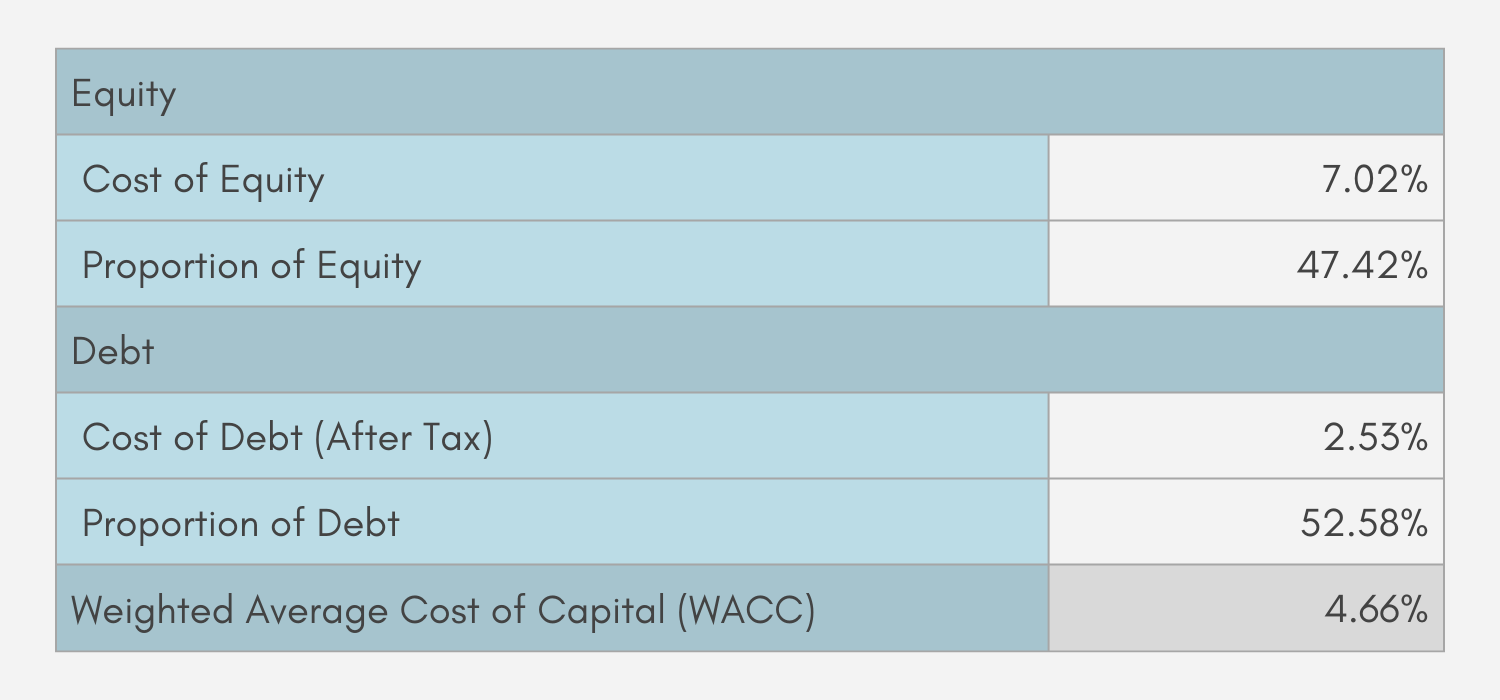
WACC’s value involves combining Tesco’s costs of equity and debt, each weighted by its proportion in the capital structure. Its formula is given by:
\[WACC=Cost\,of\,Equity\times Proportion\,of\,Equity+Cost\,of\,Debt\times Proportion\,of\,Debt.\]
From our calculation, Tesco’s costs of equity and debt are 7.02% and 2.53% respectively. We also calculate that equity forms 47.42% of Tesco’s capital structure, while debt forms 52.58%.
According to its formula, Tesco’s WACC is then calculated to be 4.66% (to 2 d.p.).
Costs Calculation
Cost of Debt

For WACC calculation, the after-tax cost of debt is used as interest payments are generally tax-deductible. The after-tax cost of debt is calculated by multiplying the interest rate (before-tax cost of debt) by the tax rate.
We assume Tesco’s interest rate to be 2.99%. This is based on the last three years’ (2021-2023) average of the proportion of the interest paid by Tesco10 forms of the total value of its financial (non-operating) liabilities.11
We assume the tax rate to be 15.50%, which is based on the average of tax paid by Tesco12 as a proportion of its EBIT13 from 2009-2023.
Using these values of interest and tax rates, Tesco’s cost of debt (after tax) is 3.00%.
Cost of Equity
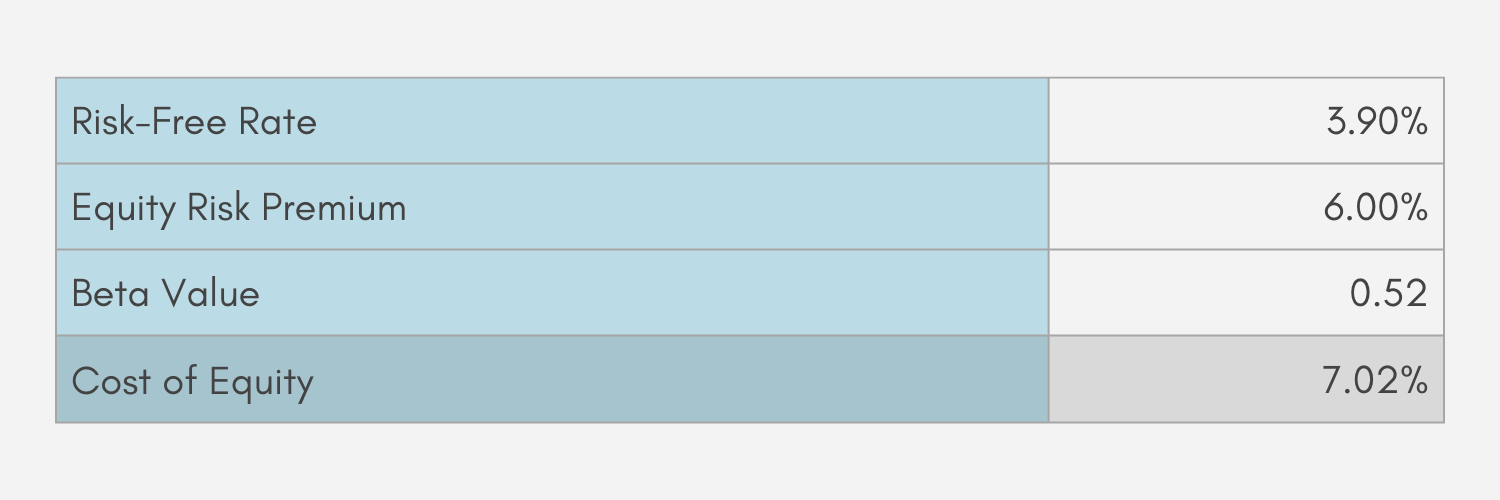
The formula for cost of equity is given by:
\[Risk\,Free\,Rate+(Equity\,Risk\,Premium\times Beta\,Value).\]
We base the risk-free rate on the UK average risk-free rate on investments, which is 3.90% in 2023.14 Our value of equity risk premium is in turn based on the UK market risk premium in 2023, which is 6.00%.15 The beta value for Tesco is 0.52.16
Using these values and its formula, Tesco’s cost of equity is 7.02%.
Proportions of Debt and Equity in Capital Structure
Total Debt
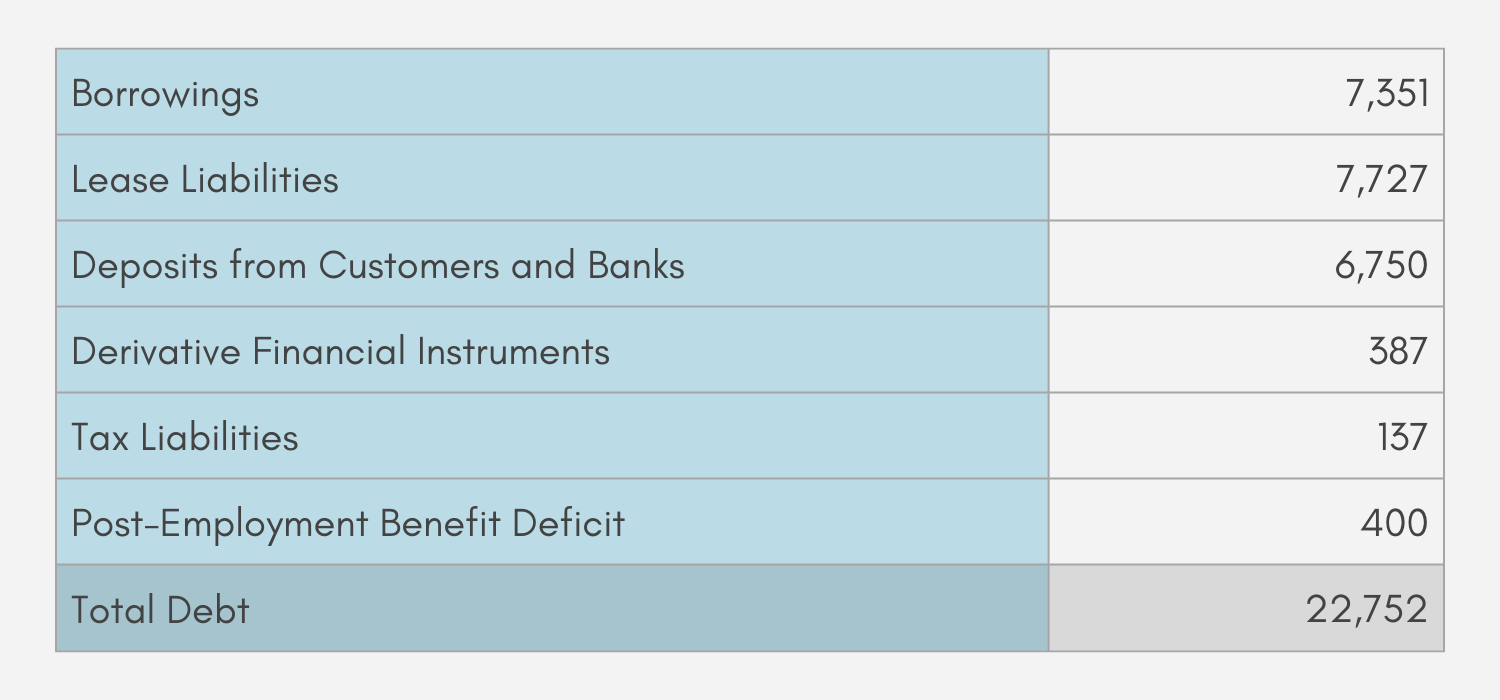
In the context of its capital structure, Tesco’s total debt refers to the sum of its financial (non-operating) liabilities, which are liabilities not involved in Tesco’s ongoing operations. From Tesco’s liability items,17 we identify the following items as being financial liabilities:
- borrowings
- lease liabilities
- deposits from customers and banks
- derivative financial instruments
- tax liabilities
- post-employment benefit deficit.
Table 7 displays the value of each of these items. Summing these values together, Tesco’s total debt is £22,752m.
Total Equity

Total equity, in the context of capital structure, is calculated by multiplying the total shares outstanding by the share price. As of December 29, 2023, Tesco’s total shares outstanding were 7,064m18 and its closing share price was £2.905 (to 3 d.p.).19 This results in Tesco’s total equity equaling £20,521m.
Proportions in Capital Structure
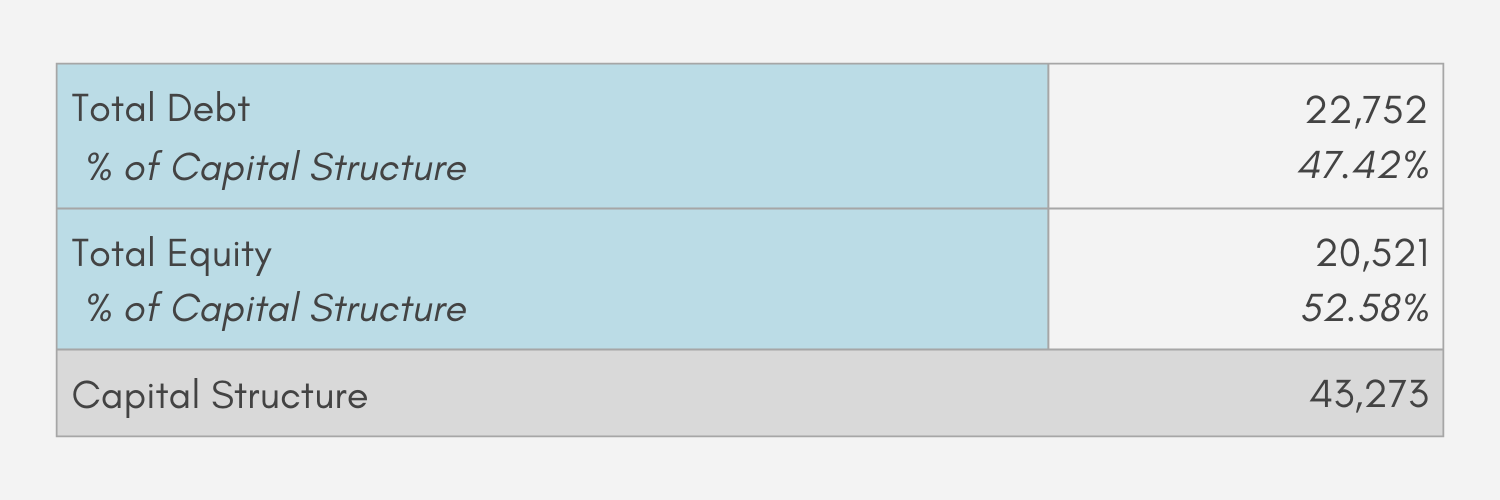
Tesco’s capital structure consists of its total debt and total equity. From previous calculations, Tesco’s total debt and total equity are £22,752m and £20,521m. This results in Tesco’s capital structure being £43,273m.
Dividing total debt and total equity by the capital structure shows that debt forms 47.42% and equity forms 52.58% of Tesco’s capital structure.
Calculation of the Sum of Discounted Free Cash Flows
We forecast Tesco’s free cash flows by forecasting the values of their components, and then use the forecasted values of these components to calculate our forecasted free cash flows. We then discount these forecasted free cash flows and sum them together.
Components of Free Cash Flows
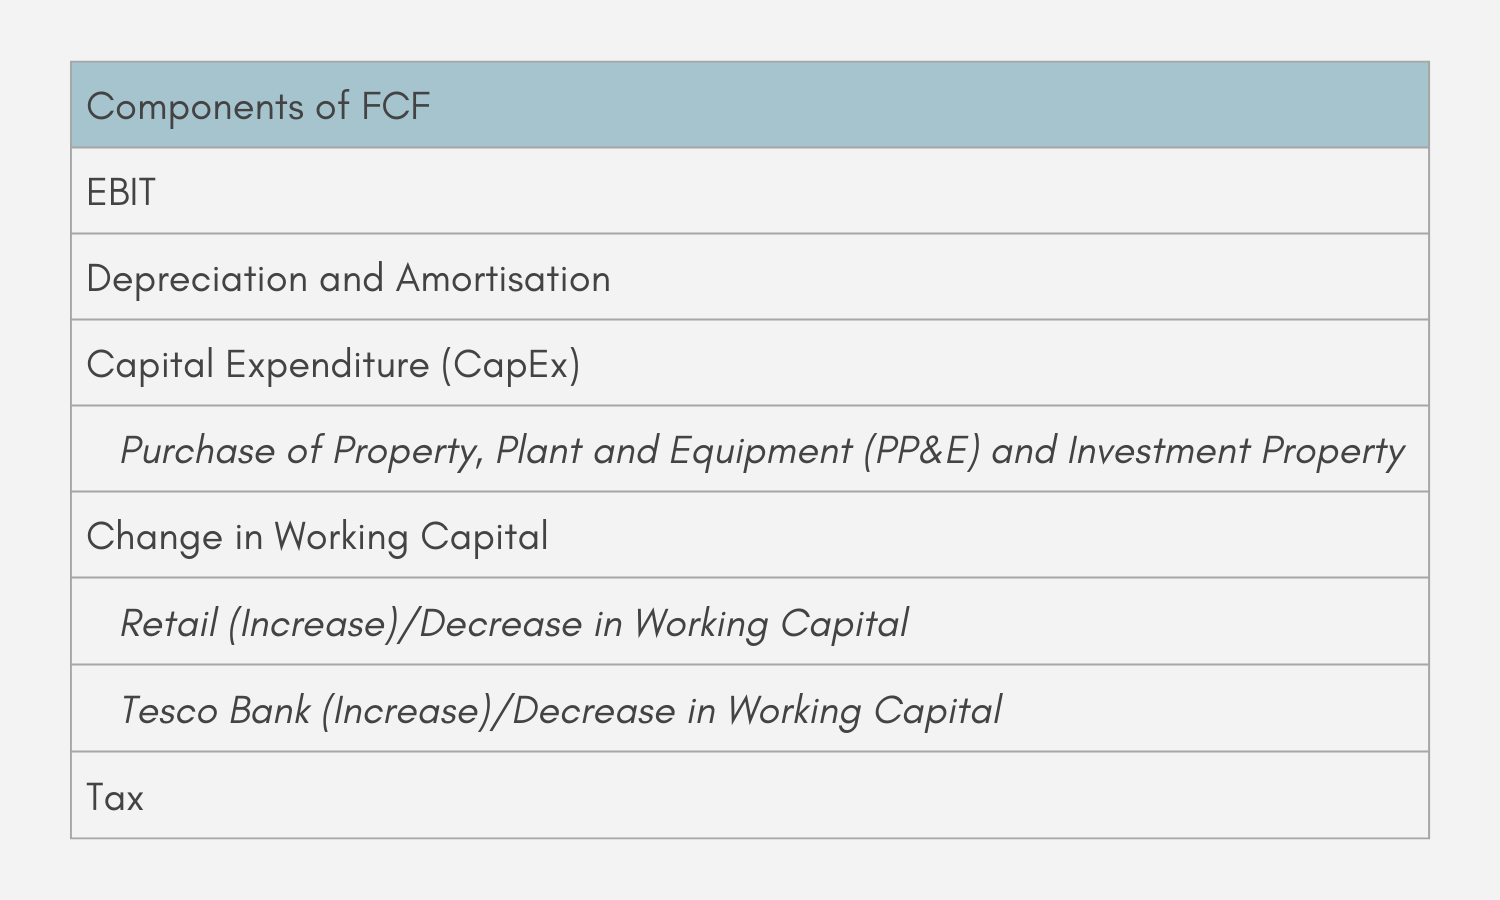
With simplifications, the components of Tesco’s free cash flow each year include its EBIT, depreciation and amortisation, capital expenditure (CapEx), change in working capital and tax.20
EBIT, CapEx and change in working capital further have sub-component(s). CapEx has one sub-component, which is the purchase of property, plant and equipment (PP&E) and investment property.21
Change in working capital has two sub-components, by breaking down the (increase)/decrease in working capital into those related to retail and those related to Tesco Bank.22 (The value is negative when there is an increase in working capital, and positive when there is a decrease.) The total change in working capital then involves adding these two sub-components together.
Tesco’s free cash flow then results from adding EBIT, depreciation and amortisation and change in working capital (where its value should be negative for a decrease and positive for a decrease) together, and then subtracting CapEx and tax from this sum.
Components of EBIT
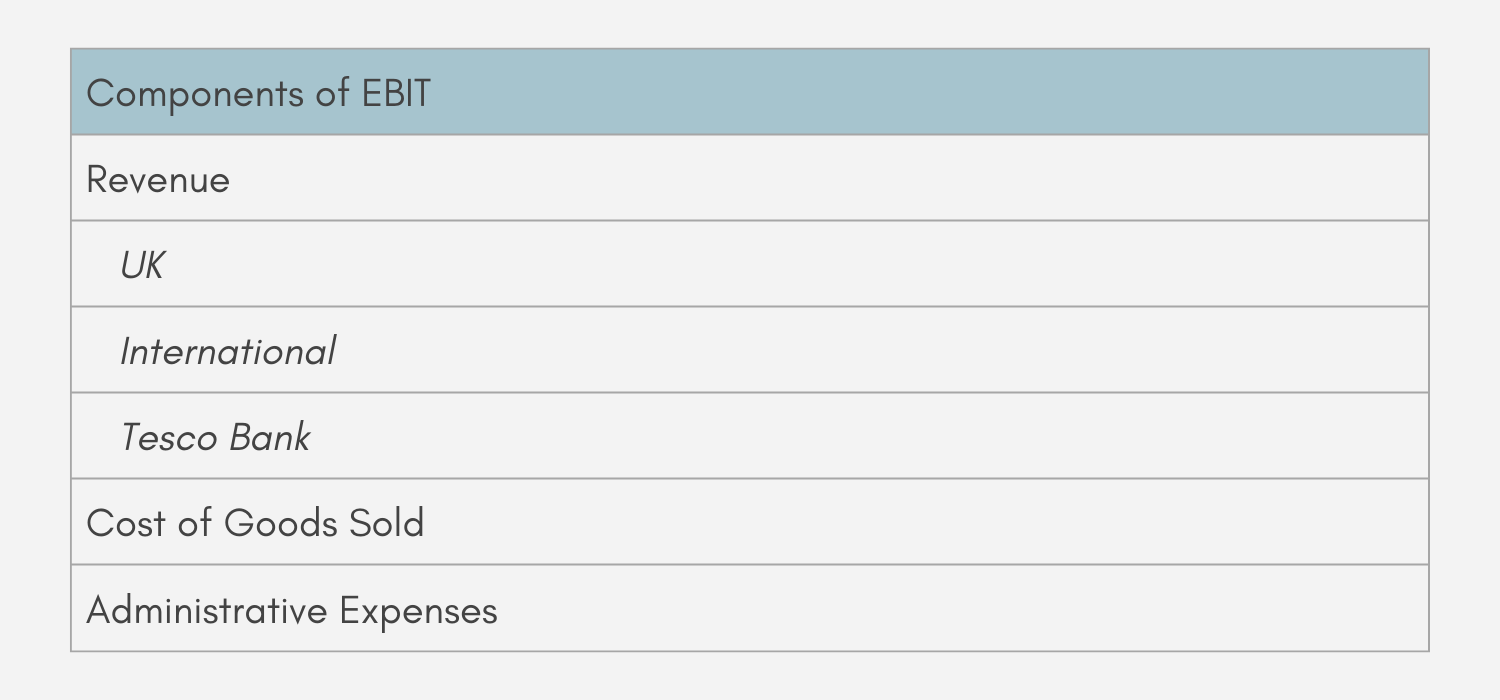
Like free cash flow, we also forecast Tesco’s EBIT by forecasting the values of its components. Tesco’s components of EBIT include revenue, cost of goods sold and administrative expenses.23
Revenue is further broken down into revenues from UK sales, from international sales and from Tesco Bank.24 The total revenue then results from adding these three values together.
EBIT is then calculated by subtracting the total revenue by the cost of goods sold and administrative expenses.
Component Forecasting Methods
Our forecast of components that make up free cash flow and EBIT involves using different methods for different components. The method that is most suitable for each component is selected for its forecast.
Forecasting Methods of EBIT Components
Revenue Forecasting Methods
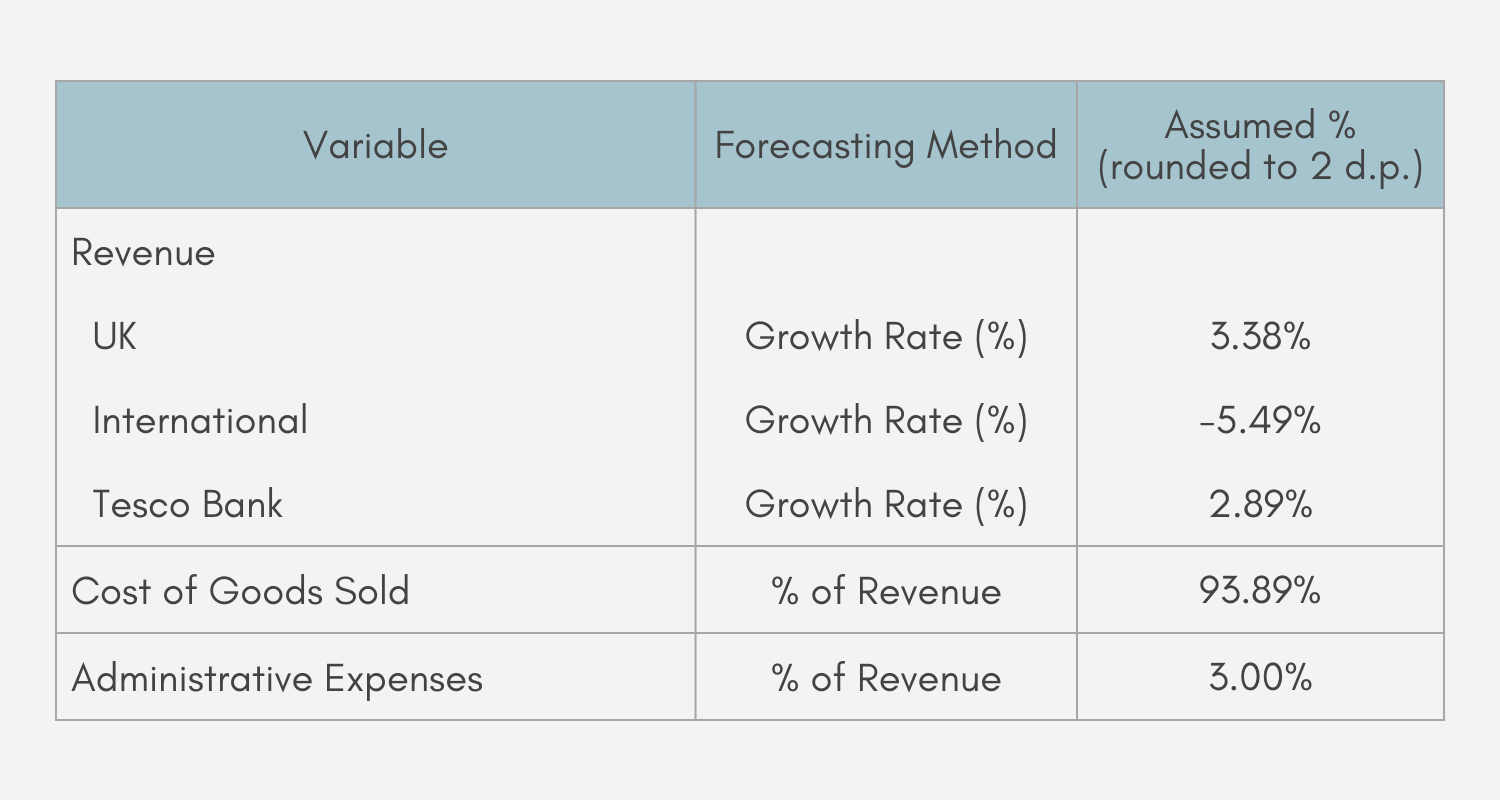
We forecast each sub-component of revenue by assuming that it would grow each year at a certain rate (which is different for each sub-component). The assumed growth rate of each revenue sub-component is in turn based on the average of its year-on-year growth rates from 2009-2023.
For UK, international and Tesco Bank, these averages of growth rates are 3.38%, -5.49% and 2.89% respectively. To forecast their future values, it is then assumed that the revenue sub-components will grow at these rates in future years.
After the revenue sub-components for each year are forecasted, we add these forecasted values together to result in the forecasted value of total revenue for the year.
Costs Forecasting Methods
For the cost of goods sold and administrative expenses, we assume that, in future years, they each form a certain proportion of total revenue (with this proportion being different between the cost of goods sold and administrative expenses). Our assumptions of what these proportions are for each item are based on the average of the proportions of revenue it formed from the years 2009-2023.
From 2009-2023, the cost of goods sold on average formed 93.89% of total revenue. For administrative expenses, this proportion was 3.00% of revenue. For each of the forecasting years, we then forecast the values of these two items by multiplying the forecasted total revenue for that year by these proportions.
EBIT Components Data for the Years 2009-2023
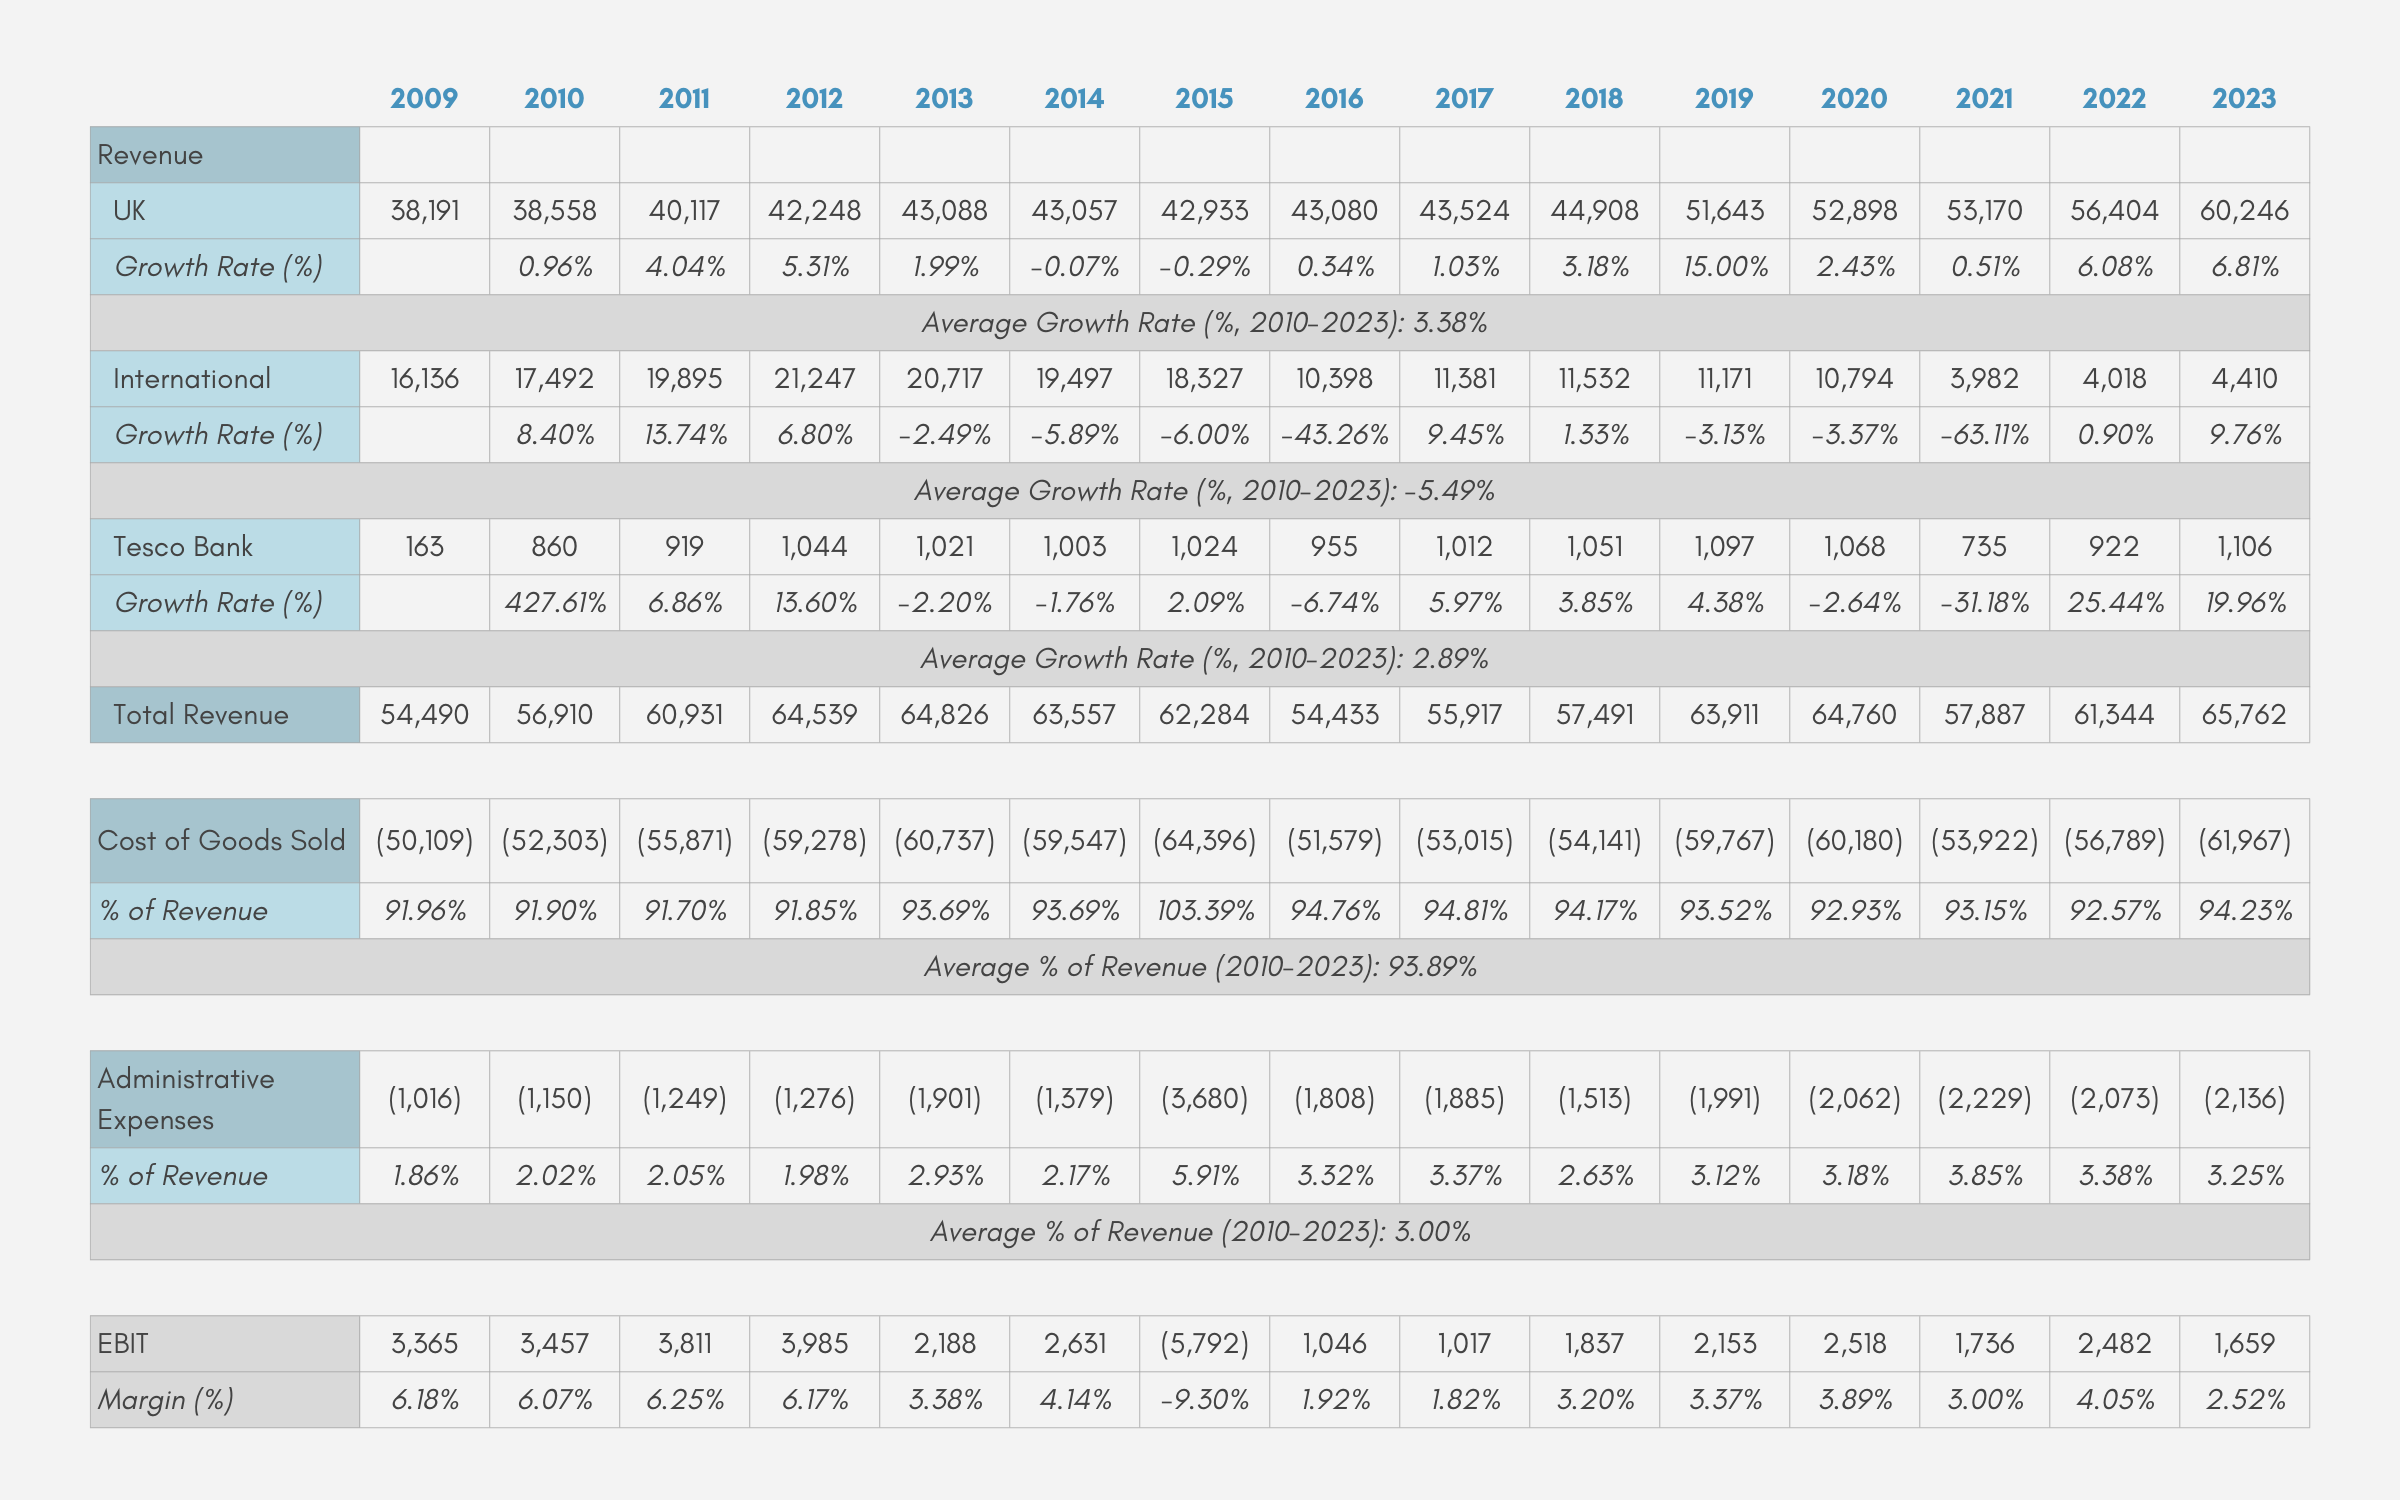
Table 13 shows the values of the components of EBIT from the years 2009-2023.25
Additionally, it shows the year-on-year growth rate of each of the revenue components. It can then be seen that the average year-on-year growth rates during this time range of revenues from UK sales, international sales and Tesco Bank are 3.38%, -5.49% and 2.89% respectively.
Table 13 also shows, for each year, the proportions of total revenue that cost of goods sold and administrative expenses formed. It can also be seen that for this time range, cost of goods sold and administrative expenses, on average, formed 93.89% and 3.00% of total revenue respectively.
Forecasting Methods of Other Free Cash Flow Components
Components Assumed to Form Proportions of Revenue
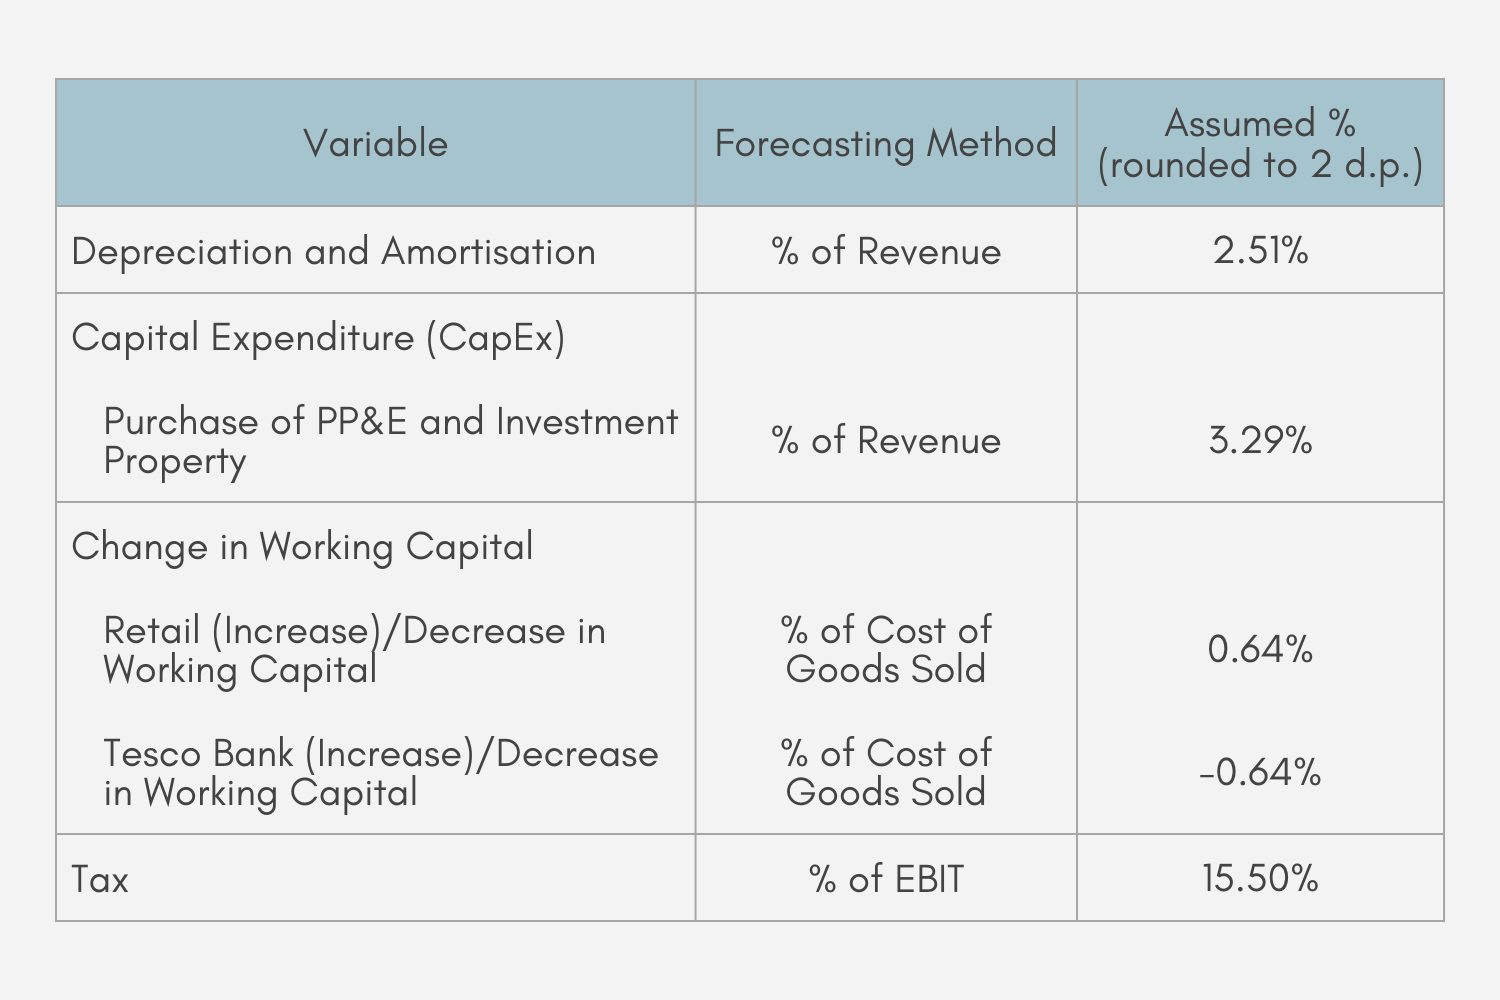
We assume that, in future years, depreciation and amortisation, and the purchase of PP&E and investment property (sub-component of CapEx) would each form a certain proportion of total revenue (with the proportions being different between the two items). We then base our assumption on the proportion of revenue each of the two items would form on the average proportion of revenue they formed from the years 2009-2023.
For this time range, on average, depreciation and amortisation formed 2.51% of total revenue, while the purchase of PP&E and investment property formed 3.29% of total revenue. We then forecast their future values by, for each year, multiplying the year’s forecasted total revenue by these proportions.
As the purchase of PP&E and investment property is the only sub-component of capital expenditure (CapEx), our forecasted values of CapEx are equal to those of the purchase of PP&E and investment property.
Components Assumed to Form Proportions of Cost of Goods Sold
Both sub-components of change in working capital, the (increase)/decrease in working capital for retail and for Tesco Bank (displayed as a positive value for a decrease and a negative value for an increase), are each assumed to form a certain proportion of the cost of goods sold.
The assumed proportion of cost of goods sold each of the two items would form is also based on the average of the proportions of the cost of goods sold it formed from years 2009-2023.
The (increase)/decrease in working capital for retail, on average, formed 0.64% of the cost of goods sold, while the (increase)/decrease in working capital for Tesco Bank on average formed -0.64% of the cost of goods sold. (As the cost of goods sold was always in itself positive during this time range, this means that on average, there was a decrease in working capital for retail and an increase in working capital for Tesco Bank.)
The values of the (increase)/decrease in working capital for retail and for Tesco Bank for each of the future years are then forecasted by multiplying the year’s forecasted cost of goods sold by 0.64% and -0.64% (respectively). For each of these future years, the forecasted values of these two items are then added together to form the forecasted change in working capital.
Component Assumed to Form a Proportion of EBIT
We forecast the values of tax in future years by assuming that they would form a certain proportion of their years’ EBIT.
Again, we base this proportion of EBIT that tax would form on the average of the proportions of EBIT tax formed from the years 2009-2023. On average, during this time range, tax formed 15.50% of EBIT.
As a result, we forecast the value of tax in each of the future years by multiplying the year’s forecasted EBIT by 15.50%.
Free Cash Flow Components Data for the Years 2009-2023
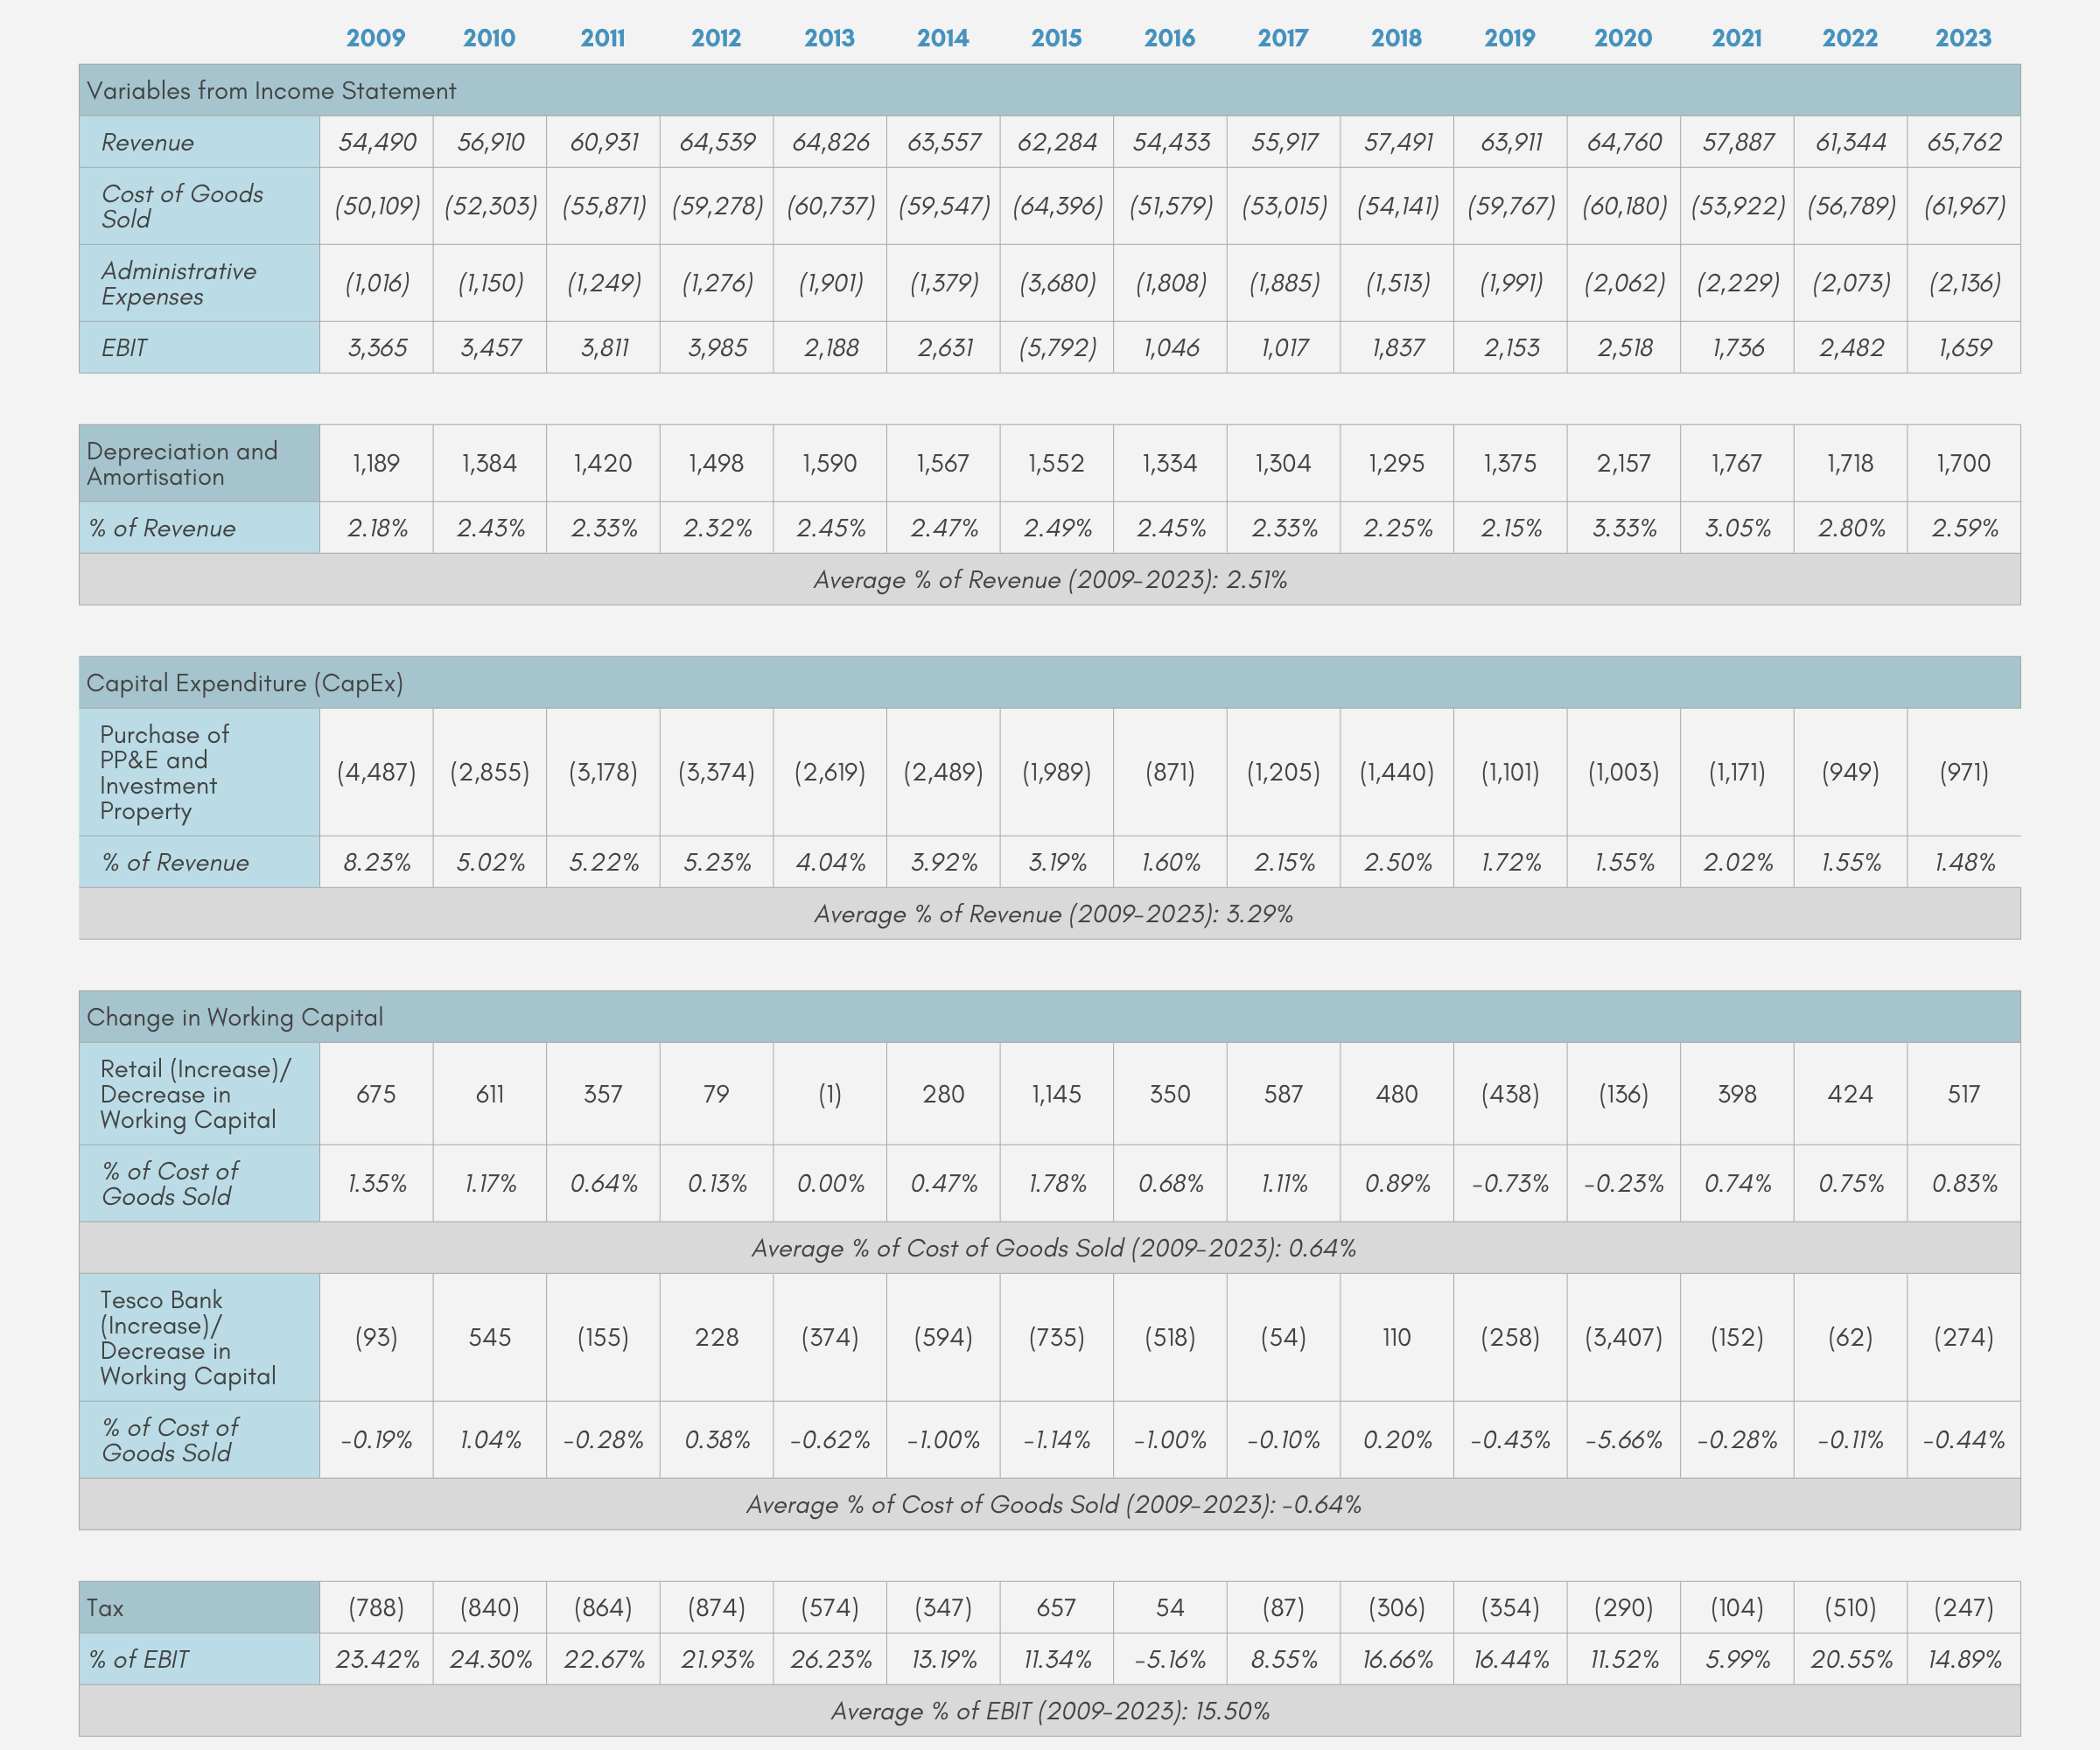
Table 15 shows, for the years 2009-2023, the values of the components of free cash flow, as well as those of the key variables from the income statement.26 For each component of the free cash flow, the table also shows, for each year, the proportion it formed of the component to be used for its forecasting.
It can then be seen that, on average, the value of depreciation and amortisation each year formed 2.51% of the revenue for its year, while the purchase of PP&E and investment property formed 3.29%.
It can further be seen that, for each year, the (increase)/decrease in working capital for retail and for Tesco Bank formed 0.64% and -0.64% respectively of the year’s cost of goods sold.
Finally, it can be seen that each year’s tax formed on average 15.50% of the year’s EBIT.
Forecasting Results
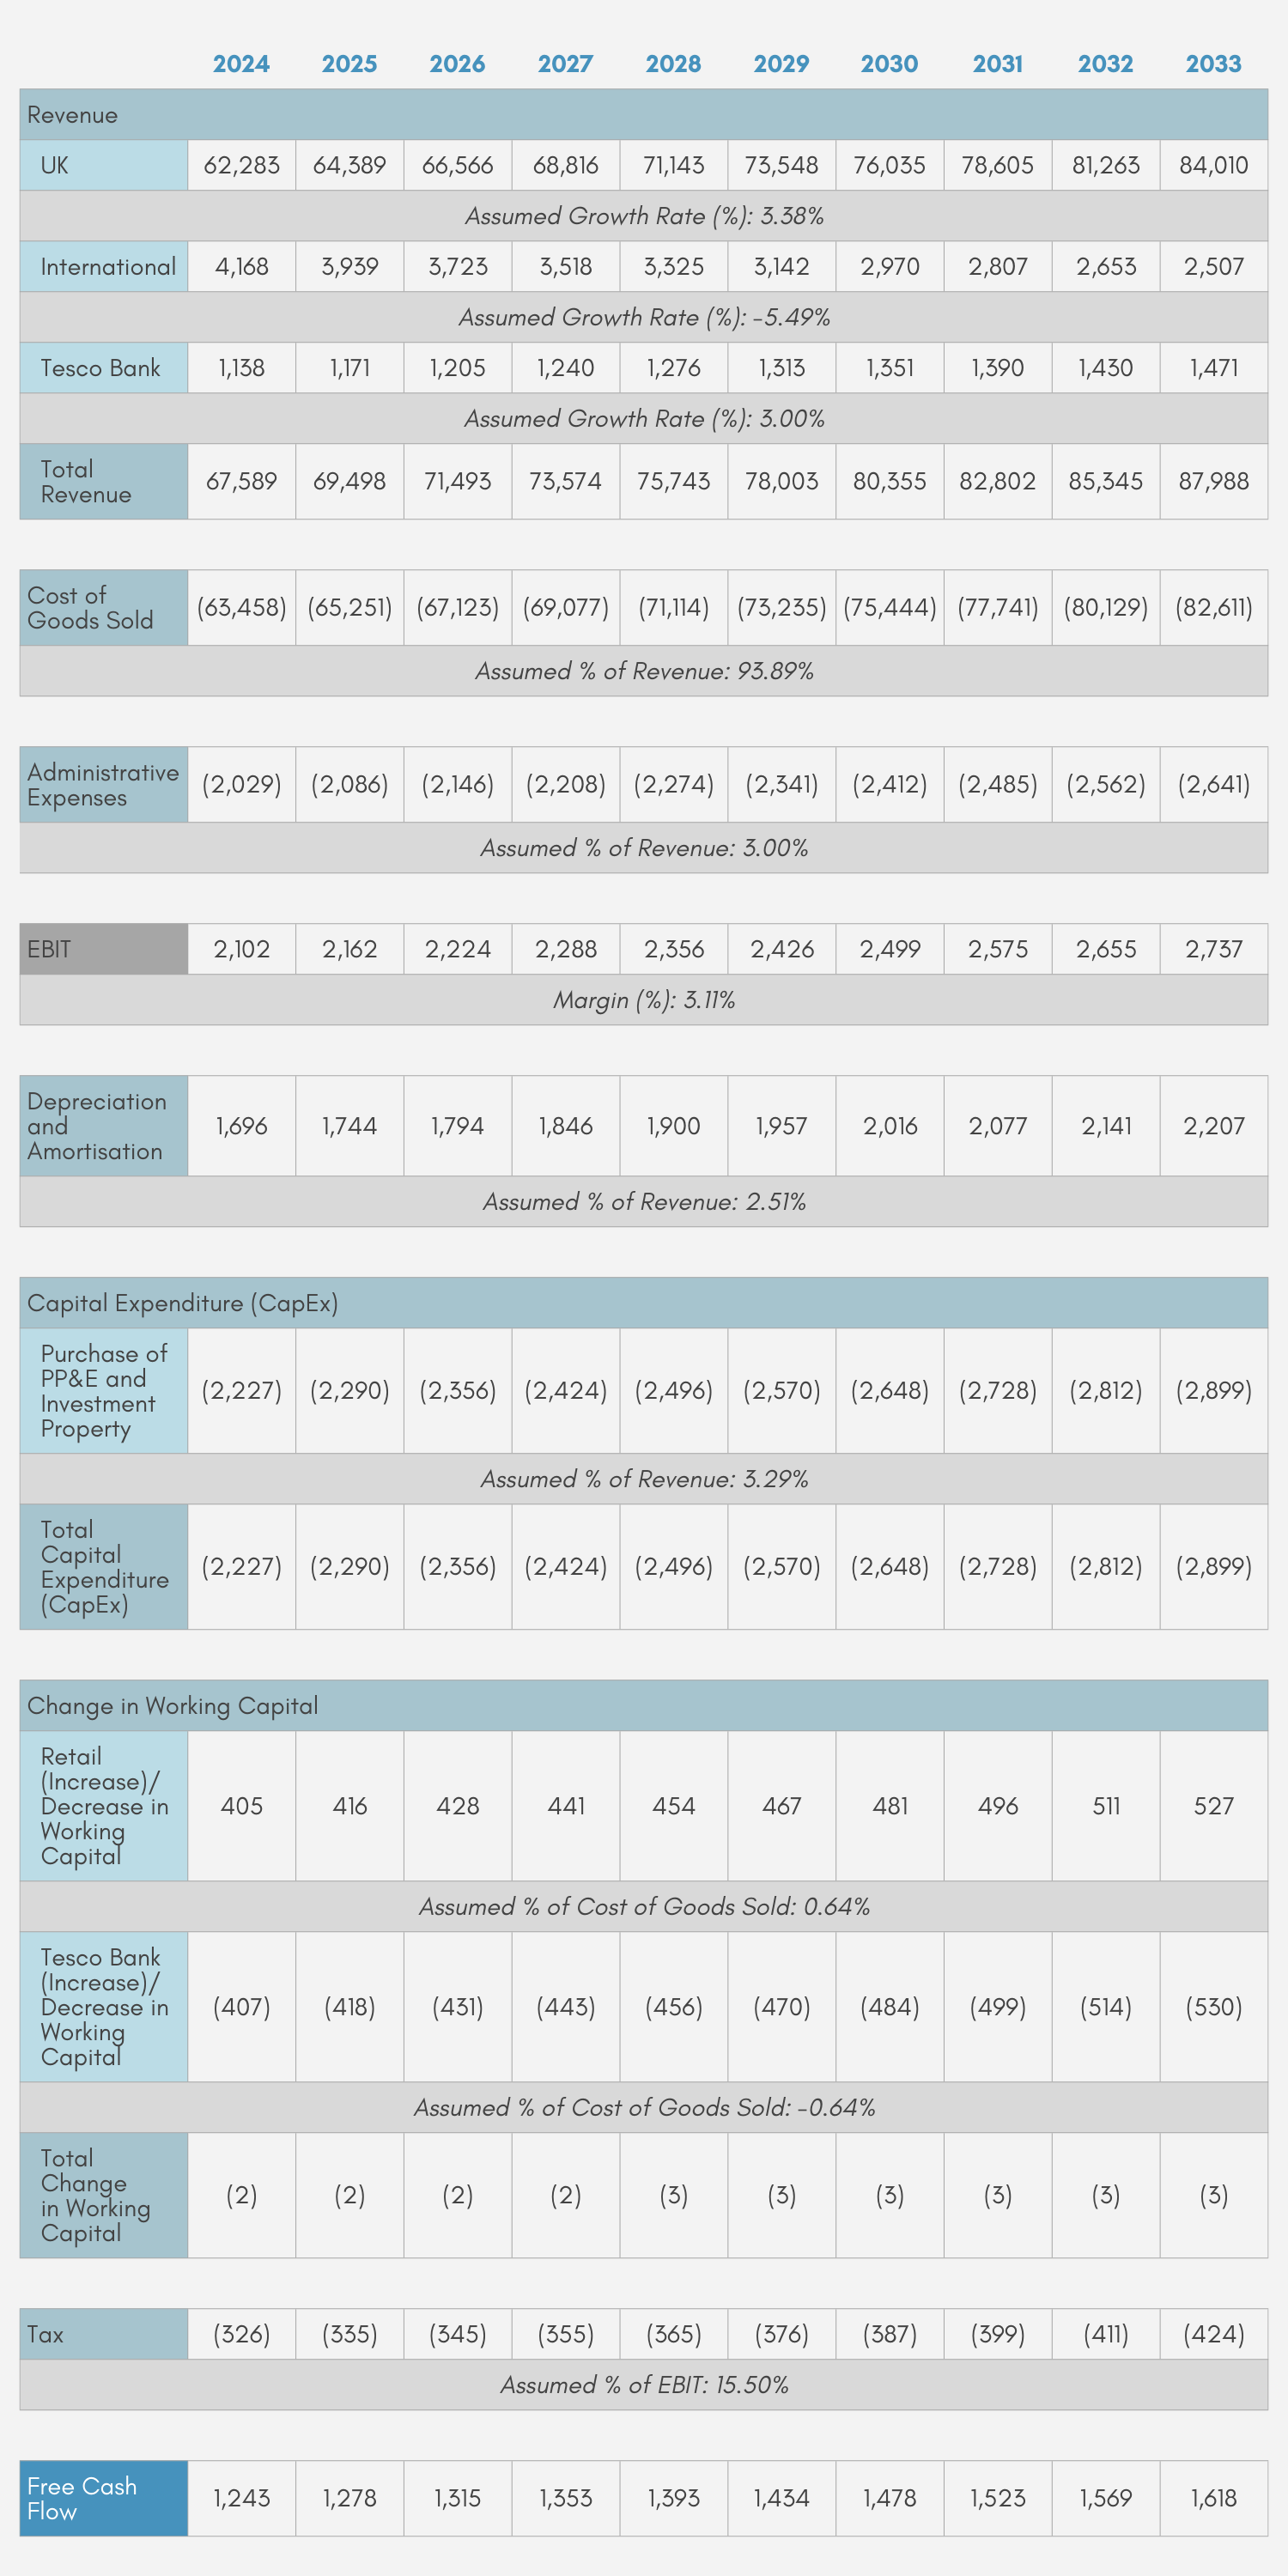
Using the forecasting methods previously described, Table 16 shows the forecasted values of the free cash flow components (with EBIT further broken down to show the forecasted values of its own components) for the years 2024-2033.
For each year, the forecasted value of each revenue component is that of its own value in the previous year growing by its assumed growth rate. For the years 2025-2033, the value of each revenue component in the previous year is the forecasted value using the same method with the value from the further previous year. For the year 2024, the values of the revenue components are forecasted based on their actual values in 2023 growing by the assumed growth rates.
Using the forecasted values of the revenue components for each year, the year’s forecasted total revenue is derived by summing these values together. Cost of goods sold and administrative expenses for each year are then forecasted by multiplying this forecasted total revenue for the year by the assumed proportions. Finally, the year’s EBIT is then forecasted by subtracting total revenue by the cost of goods sold and administrative expenses.
With these results, the other components–depreciation and amortisation, purchase of PP&E and investment property, (increase)/decrease in working capital for retail and for Tesco Bank, tax–can then be forecasted. Their values each year are forecasted by multiplying the year’s forecasted values of the relevant variables (total revenue, cost of goods sold, or EBIT) by their assumed proportions.
After this, the forecasted values of capital expenditure (CapEx) are then derived from the forecasted values of the purchase of PP&E and investment property (as it forms the only component of CapEx). The forecasted change in working capital each year is also derived from summing the year’s forecasted (increase)/decrease in working capital for retail and for Tesco Bank.
Based on these forecasted values, the forecasted free cash flow for each year is calculated by adding depreciation and amortisation, and change in working capital to EBIT, and then subtracting CapEx and tax. Our calculated values of the forecasted free cash flow for the years 2024-2033 are shown in the bottom row of Table 16.
Discounting Free Cash Flows and Calculating a Sum
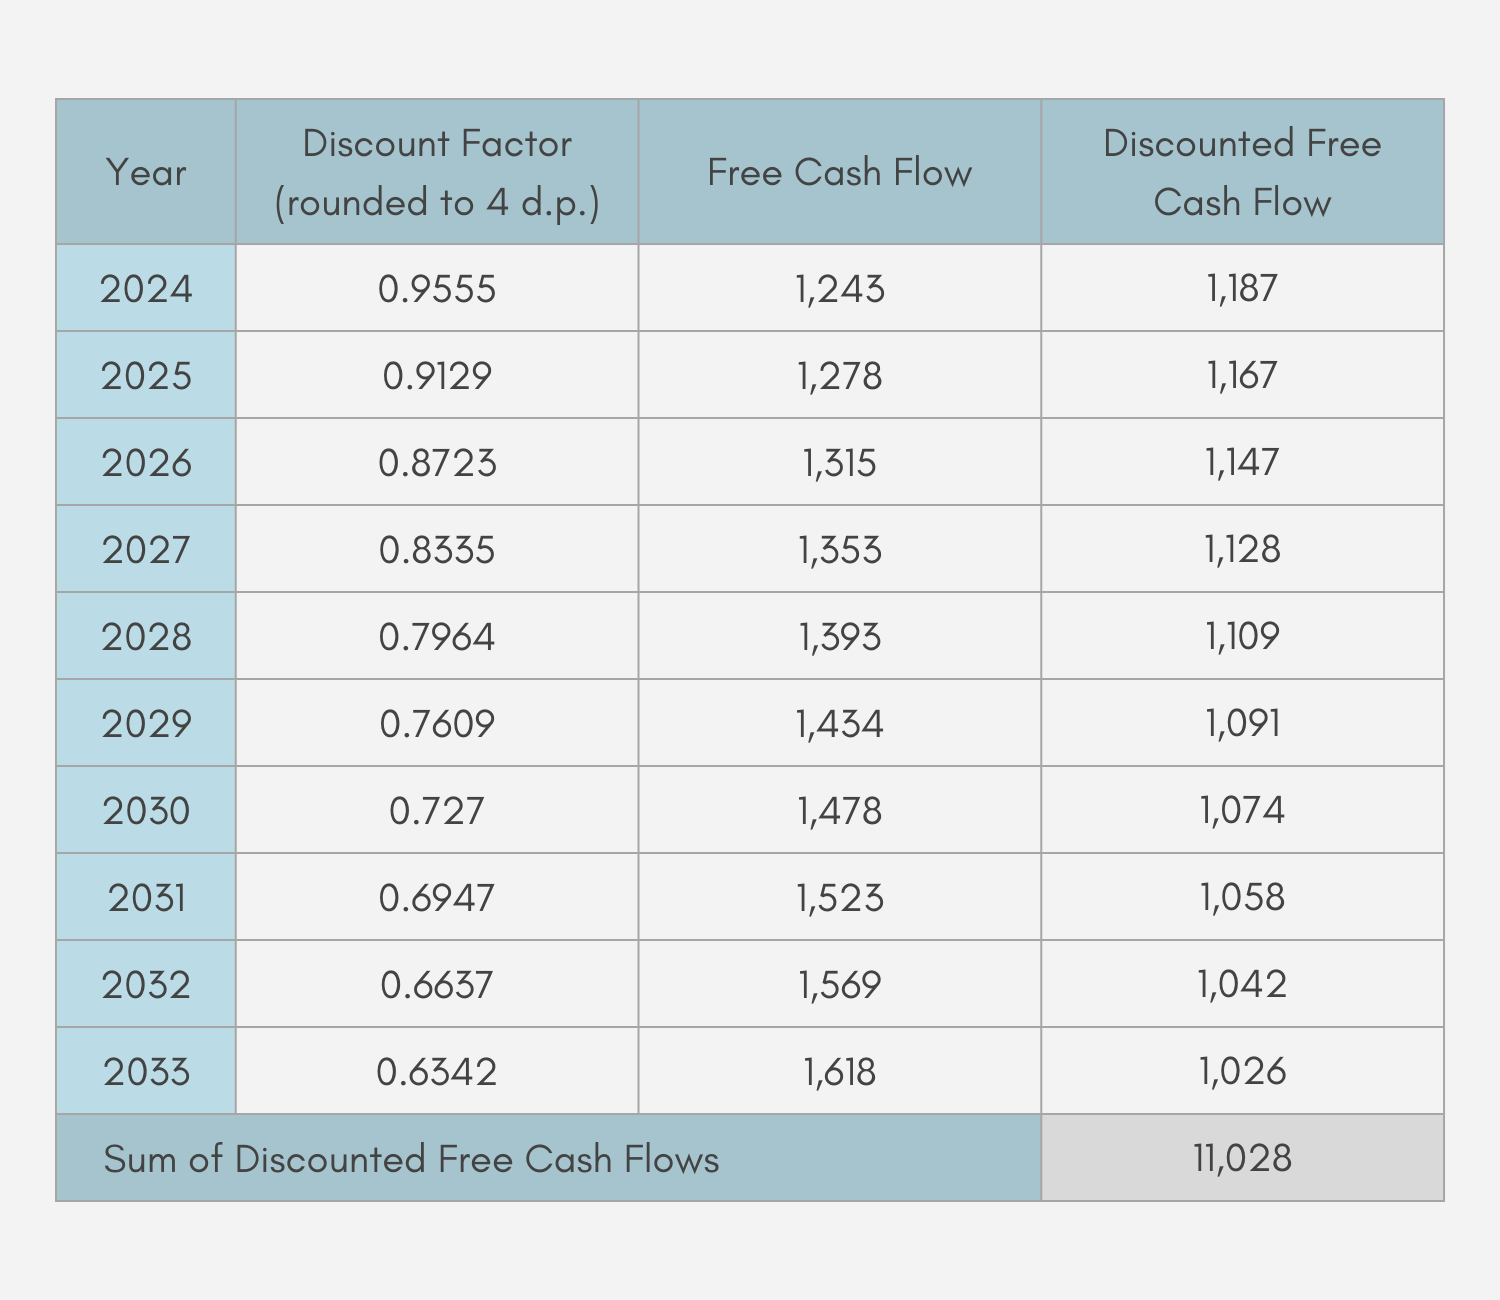
Free cash flows in future years would, however, have lower values at the present period than they would in their years. This then means that they have to be discounted. Denoting n as the number of years from the present year, the formula for calculating the discount factor is given by:
\[\frac{1}{(1+WACC)^{n}}.\]
Based on our previously estimated value of WACC (4.66%) and with 2023 being the present year, Table 17 shows our calculated discounted factors for the years 2024-2033.
For each year, Table 17 also shows our forecasted (undiscounted) free cash flow for Tesco. The value of discounted free cash flow for each year can then be estimated by multiplying these two values (discount factor and forecasted free cash flow) together.
Table 17 then shows our forecast of discounted free cash flows for the years 2024-2033. Using these values, the sum of discounted free cash flows for 2024-2033 is £11,028m.
Calculation of Discounted Terminal Value

Terminal value refers to the value of Tesco beyond the last forecasting year (in this case beyond 2033). With FCF denoting the forecasted undiscounted free cash flow in the final forecasting year, the terminal value’s formula is given by:
\[\frac{FCF\times(1+PGR)}{WACC-PGR}.\]
We use our forecasted (undiscounted) free cash flow for the year 2033, which is £1,618m, as the free cash flow in the final forecasting year (FCF). For the weighted average cost of capital (WACC), we use our previously estimated value of 4.66%.
In a DCF analysis, the perpetual growth rate of free cash flow (PGR) is usually assumed to be between 2.00-4.00%.27 Based on historical UK GDP growth rates,28 we decide to assume PGR to be 2.00%.
According to its formula and the values we use, Tesco’s (undiscounted) terminal value in this case is calculated to be £62,052m.
However, this undiscounted terminal value refers to the value in the last forecasting year (2033). In the present year (2023), this future value is worth less and needs to be discounted. We use our calculated discount factor for the year 2033, which is 0.6342. Discounted terminal value is then calculated by multiplying this by the undiscounted terminal value. This results in the discounted terminal value of £39,352m.
Summary and Limitations
With the assumptions of 4.659503% WACC and 2.00% PGR, we estimate Tesco’s implied share price to be 487.60p, which forms a 67.85% premium to the current share price. The previous sections describe the process we go through and the variables we use to arrive at these estimated values, including the calculation of Tesco’s equity and enterprise values, which are in turn supported by our results from the calculation of discounted free cash flows and discounted terminal value.
A key limitation of DCF valuation however is that a relatively large number of assumptions are required. This raises an issue as the assumptions we use may not be accurate, which is a further problem in DCF valuation as the results can be sensitive to changes in assumptions. Additionally, our derivations of assumptions regarding the forecast of the future values of free cash flow components are relatively rough, and do not take into account other key factors that may impact the different cash flow components within the industries and markets Tesco operates in.
References
- Tesco PLC. (2024). Our History. https://www.tescoplc.com/about/our-history.
- Tesco PLC. (2024). Contacts. https://www.tescoplc.com/contacts.
- Investopedia. (2023). Discounted Cash Flow (DCF) Explained With Formula and Examples. https://www.investopedia.com/terms/d/dcf.asp.
- YCharts. (2024). Tesco Shares Outstanding. https://ycharts.com/companies/TSCDF/shares_outstanding.
- Financial Times. (2024). Tesco PLC Historical Prices. https://markets.ft.com/data/equities/tearsheet/historical?s=TSCO:LSE.
- Tesco PLC. (2023). Annual Report and Financial Statements 2023. https://www.tescoplc.com/media/u1wlq2qf/tesco-plc-annual-report-2023.pdf.
- Ibid.
- Investing.com. (2024). TSCO Balance Sheet. https://uk.investing.com/equities/tesco-balance-sheet.
- Tesco PLC. (2023). Annual Report and Financial Statements 2023. https://www.tescoplc.com/media/u1wlq2qf/tesco-plc-annual-report-2023.pdf.
- Tesco PLC. (2021). Annual Report and Financial Statements 2021. https://www.tescoplc.com/media/lfhl0lg4/tesco_annual_report_2021-2.pdf; Tesco PLC. (2022). Annual Report and Financial Statements 2022. https://www.tescoplc.com/media/759057/tesco-annual-report-2022.pdf; Tesco PLC. (2023). Annual Report and Financial Statements 2023. https://www.tescoplc.com/media/u1wlq2qf/tesco-plc-annual-report-2023.pdf.
- Ibid.
- Tesco PLC. (2009). Annual Report and Financial Statements 2009. https://www.tescoplc.com/media/4bopuvw0/annual_report_2009.pdf; Tesco PLC. (2010). Annual Report and Financial Statements 2010. https://www.tescoplc.com/media/kxoifct3/annual_report_2010.pdf; Tesco PLC. (2011). Annual Report and Financial Statements 2011. https://www.tescoplc.com/media/4ixd0444/tesco_annual_report_2011.pdf; Tesco PLC. (2012). Annual Report and Financial Statements 2012. https://www.tescoplc.com/media/nlgdaagt/tesco_annual_report_2012.pdf; Tesco PLC. (2013). Annual Report and Financial Statements 2013. https://www.tescoplc.com/media/ytpeftjg/tesco_annual_report_2013.pdf; Tesco PLC. (2014). Annual Report and Financial Statements 2014. https://www.tescoplc.com/media/5h2kmr55/annual_report_14.pdf; Tesco PLC. (2015). Annual Report and Financial Statements 2015. https://www.tescoplc.com/media/trqb0i1y/14-tesco-annual-report-2015.pdf; Tesco PLC. (2016). Annual Report and Financial Statements 2016. https://www.tescoplc.com/media/ji0bd5mw/15-tesco-annual-report-2016.pdf; Tesco PLC. (2017). Annual Report and Financial Statements 2017. https://www.tescoplc.com/media/y0nd0uwu/68336_tesco_ar_digital_interactive_250417.pdf; Tesco PLC. (2018). Annual Report and Financial Statements 2018. https://www.tescoplc.com/media/ffanckou/tesco_ar_2018.pdf; Tesco PLC. (2019). Annual Report and Financial Statements 2019. https://www.tescoplc.com/media/0billlmb/tesco_ara2019_full_report_web.pdf; Tesco PLC. (2020). Annual Report and Financial Statements 2020. https://www.tescoplc.com/media/yembn50k/tes006_ar2020_web_updated_200505.pdf; Tesco PLC. (2021). Annual Report and Financial Statements 2021. https://www.tescoplc.com/media/lfhl0lg4/tesco_annual_report_2021-2.pdf; Tesco PLC. (2022). Annual Report and Financial Statements 2022. https://www.tescoplc.com/media/759057/tesco-annual-report-2022.pdf; Tesco PLC. (2023). Annual Report and Financial Statements 2023. https://www.tescoplc.com/media/u1wlq2qf/tesco-plc-annual-report-2023.pdf.
- Ibid.
- Social Science Research Network. (2023). Average risk free rate (RF) on investments in the United Kingdom (UK) from 2015 to 2023 [Graph]. In Statista. https://www.statista.com/statistics/885750/average-risk-free-rate-united-kingdom.
- Social Science Research Network. (2023). Average market risk premium (MRP) in the United Kingdom (UK) from 2011 to 2023 [Graph]. In Statista. https://www.statista.com/statistics/664833/average-market-risk-premium-united-kingdom.
- Yahoo Finance UK. (2024). Tesco PLC (TSCO.L) valuation measures & financial statistics. https://uk.finance.yahoo.com/quote/TSCO.L/key-statistics.
- Tesco PLC. (2023). Annual Report and Financial Statements 2023. https://www.tescoplc.com/media/u1wlq2qf/tesco-plc-annual-report-2023.pdf.
- YCharts. (2024). Tesco Shares Outstanding. https://ycharts.com/companies/TSCDF/shares_outstanding.
- Financial Times. (2024). Tesco PLC Historical Prices. https://markets.ft.com/data/equities/tearsheet/historical?s=TSCO:LSE.
- Tesco PLC. (2009). Annual Report and Financial Statements 2009. https://www.tescoplc.com/media/4bopuvw0/annual_report_2009.pdf; Tesco PLC. (2010). Annual Report and Financial Statements 2010. https://www.tescoplc.com/media/kxoifct3/annual_report_2010.pdf; Tesco PLC. (2011). Annual Report and Financial Statements 2011. https://www.tescoplc.com/media/4ixd0444/tesco_annual_report_2011.pdf; Tesco PLC. (2012). Annual Report and Financial Statements 2012. https://www.tescoplc.com/media/nlgdaagt/tesco_annual_report_2012.pdf; Tesco PLC. (2013). Annual Report and Financial Statements 2013. https://www.tescoplc.com/media/ytpeftjg/tesco_annual_report_2013.pdf; Tesco PLC. (2014). Annual Report and Financial Statements 2014. https://www.tescoplc.com/media/5h2kmr55/annual_report_14.pdf; Tesco PLC. (2015). Annual Report and Financial Statements 2015. https://www.tescoplc.com/media/trqb0i1y/14-tesco-annual-report-2015.pdf; Tesco PLC. (2016). Annual Report and Financial Statements 2016. https://www.tescoplc.com/media/ji0bd5mw/15-tesco-annual-report-2016.pdf; Tesco PLC. (2017). Annual Report and Financial Statements 2017. https://www.tescoplc.com/media/y0nd0uwu/68336_tesco_ar_digital_interactive_250417.pdf; Tesco PLC. (2018). Annual Report and Financial Statements 2018. https://www.tescoplc.com/media/ffanckou/tesco_ar_2018.pdf; Tesco PLC. (2019). Annual Report and Financial Statements 2019. https://www.tescoplc.com/media/0billlmb/tesco_ara2019_full_report_web.pdf; Tesco PLC. (2020). Annual Report and Financial Statements 2020. https://www.tescoplc.com/media/yembn50k/tes006_ar2020_web_updated_200505.pdf; Tesco PLC. (2021). Annual Report and Financial Statements 2021. https://www.tescoplc.com/media/lfhl0lg4/tesco_annual_report_2021-2.pdf; Tesco PLC. (2022). Annual Report and Financial Statements 2022. https://www.tescoplc.com/media/759057/tesco-annual-report-2022.pdf; Tesco PLC. (2023). Annual Report and Financial Statements 2023. https://www.tescoplc.com/media/u1wlq2qf/tesco-plc-annual-report-2023.pdf.
- Ibid.
- Ibid.
- Ibid.
- Ibid.
- Ibid.
- Ibid.
- Wall Street Prep. (2024). Terminal Value. https://www.wallstreetprep.com/knowledge/terminal-value.
- Office for National Statistics. (2024). Gross Domestic Product: Year on Year growth: CVM SA %. https://www.ons.gov.uk/economy/grossdomesticproductgdp/timeseries/ihyp/pn2.

